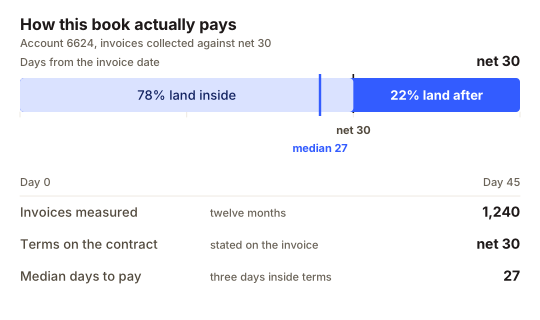
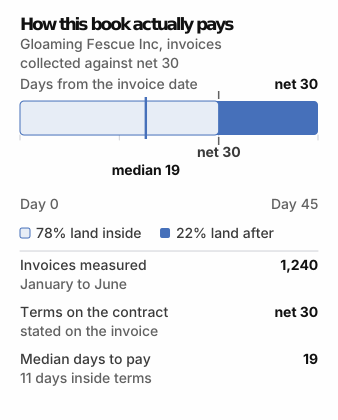
Payment habits, not due dates
Each customer's days to pay come from its own history, not from the terms on the invoice.
Cash flow forecasting
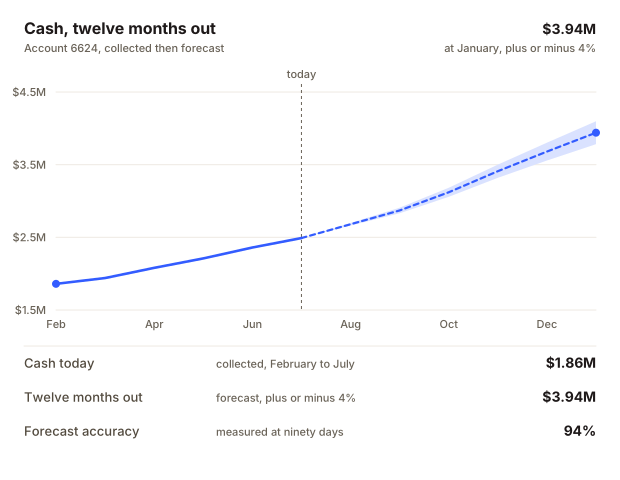
Verlix forecasts collections from real payment behaviour, invoice by invoice, and shows the likely range, not a single guess.
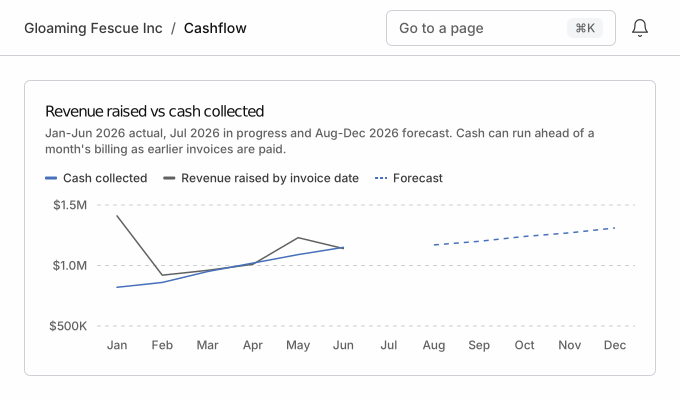
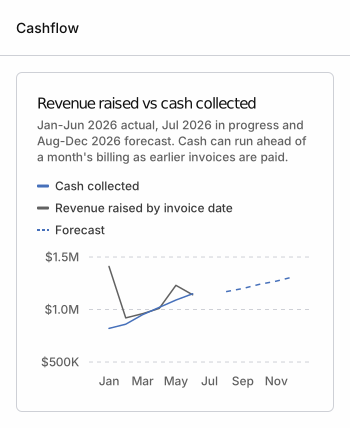
The forecast starts from today's cash and adds what each customer is likely to pay, and when.
Payment behaviour
Each customer's days to pay come from its own history, not from the terms on the invoice.
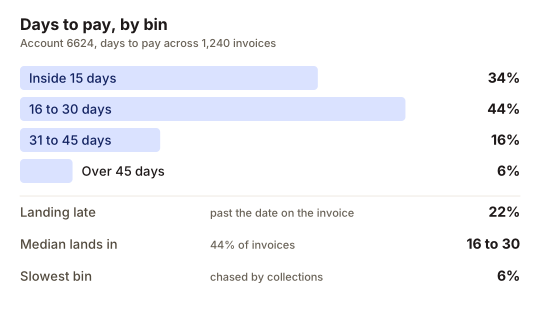
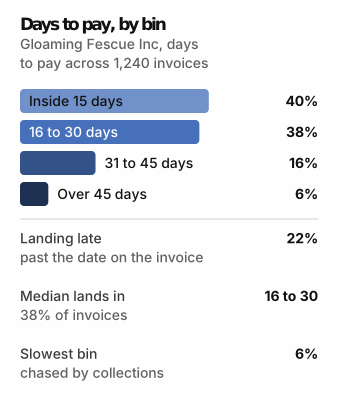
From invoices settled in a fortnight to the few past 45 days, that spread sets the forecast.
Forecast accuracy
In the example workspace, each 90-day forecast from February to June landed about 6% under actual.
Forecast against actual · Gloaming Fescue Inc
Each forecast made 90 days earlier
Forecast against actual · Gloaming Fescue Inc: rose from 860K at Feb to 1.1M at Jun across 5 points; range 860K to 1.1M.
Each month is scored against its 90-day forecast, not a later revision.
Late invoices
The $203,500 more than 30 days past due needs forecasting; the Collections agent's plan brings $318K of Q3 cash in 3 weeks early.
Open receivable by age · Gloaming Fescue Inc
$526,400 outstanding · net 30
Open receivable by age · Gloaming Fescue Inc: 1 series across 4 buckets.
Days past each invoice's due date; the first bar also holds the invoices not yet due.
Forecast range
In the example workspace, January is forecast at $3.94M, with a range of $3.70M to $4.18M.
July to January, with its band · Gloaming Fescue Inc
Expected, plus or minus 6%
July to January, with its band · Gloaming Fescue Inc: rose from 2.5M at Jul to 3.9M at Jan across 7 points; range 2.5M to 3.9M.
The dashed lines are the high and low ends of the range.
Included with Scale and above.See pricingBook demo
Product
Revenue, cash and churn forecasts from your own contracts, invoices and payments.
Product
Reminders go out the day after an invoice falls due, once you turn on the Collections agent.
Blog
Why a close takes 9 days, and which of them are just arithmetic waiting to happen.