Predictive analytics
See the likely number before the quarter ends
Verlix forecasts revenue, cash, churn and renewals 12 months ahead from your own contracts, invoices and payments, each with its range.
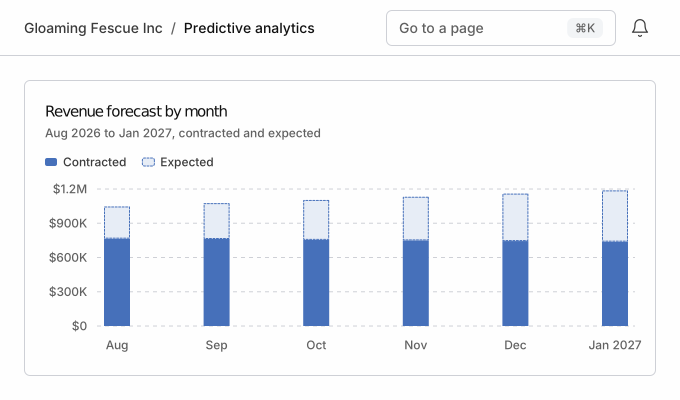
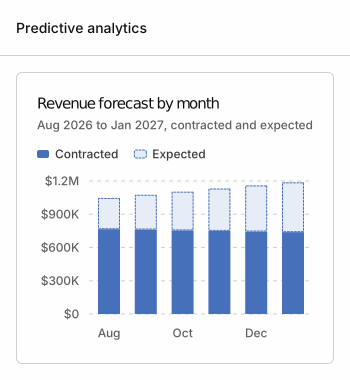
Forecasts
Who churns, and when the cash arrives
Churn warning
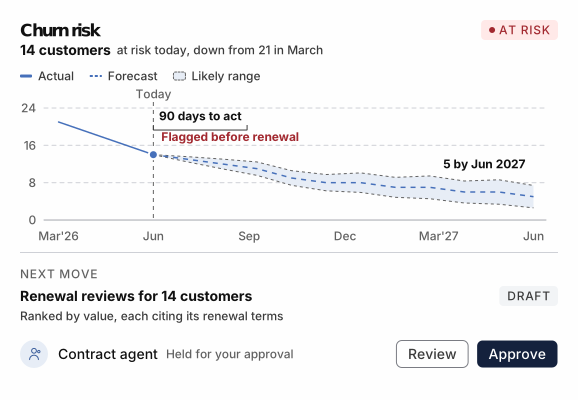
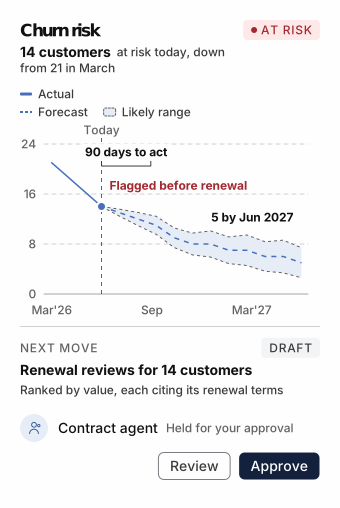
Churn risk flagged before the renewal
At-risk customers are flagged 90 days before renewal and ranked by value, and the Contract agent drafts a renewal review for each.
- Today
- 14 at risk, down from 21 in March
- Forecast
- 5 at risk by Jun 2027
- Next move
- Contract agent reviews 14 renewals
Cash forecast
Fewer surprises in the cash line
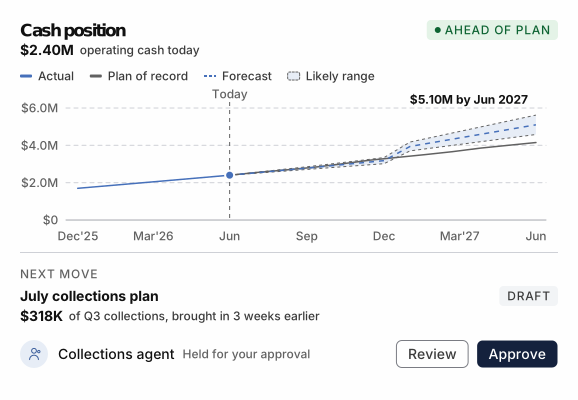
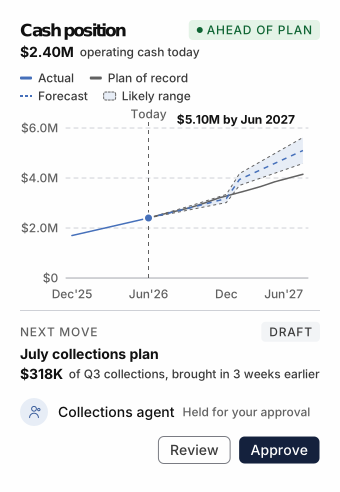
Invoices, terms and how each customer pays roll into one cash forecast beside your plan, and the Collections agent proposes how to bring cash in sooner.
- Today
- $2.40M today, ahead of plan
- Forecast
- $5.10M by Jun 2027
- Next move
- Collections agent brings $318K forward
More forecasts
Eight more forecasts
Spot expansion before the renewal call
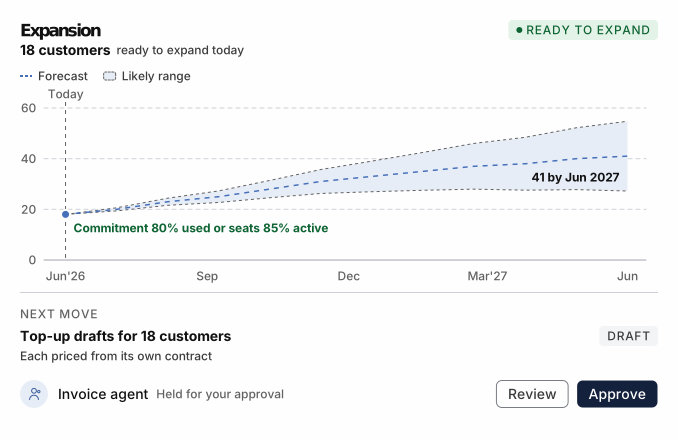
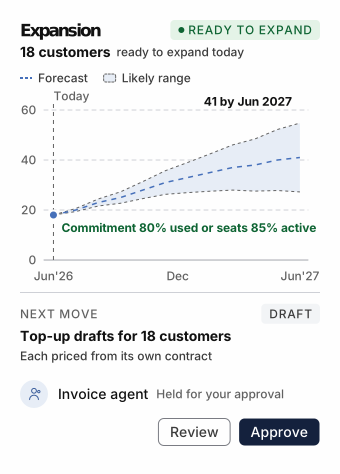
Customers that have used 80% of their commitment or have 85% of seats active are flagged, and the Invoice agent drafts each top-up from the customer's contract.
- Today
- 18 customers ready to expand
- Forecast
- 41 by Jun 2027
- Next move
- Invoice agent drafts 18 top-ups
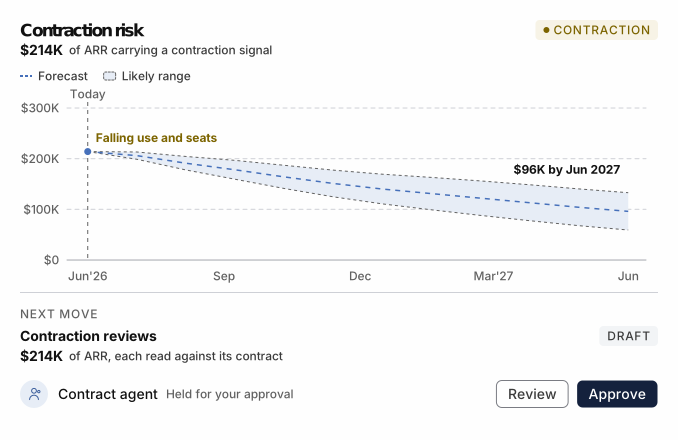
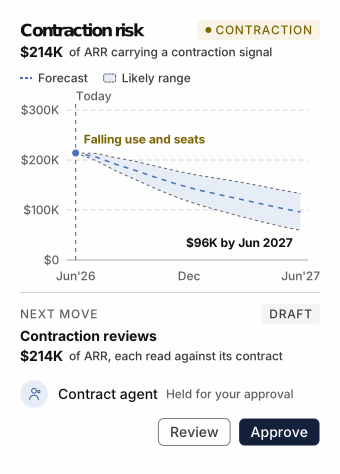
See the downgrade before the email
Falling usage, fewer active seats and slower payment combine into one risk figure, and the Contract agent reviews each flagged account before it renews.
- Today
- $214K of ARR at risk of contraction
- Forecast
- $96K by Jun 2027
- Next move
- Contract agent reviews $214K of ARR
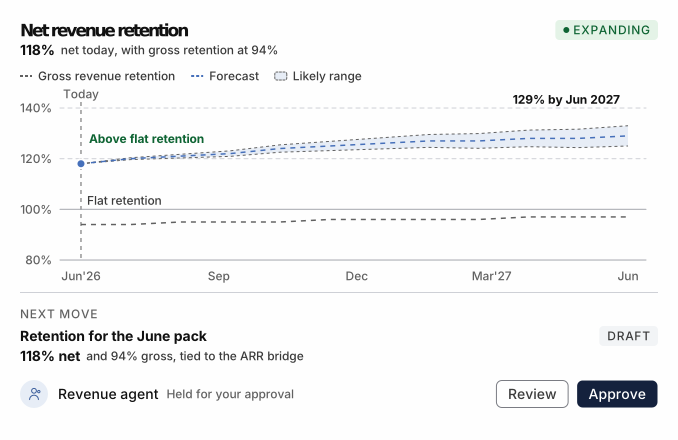
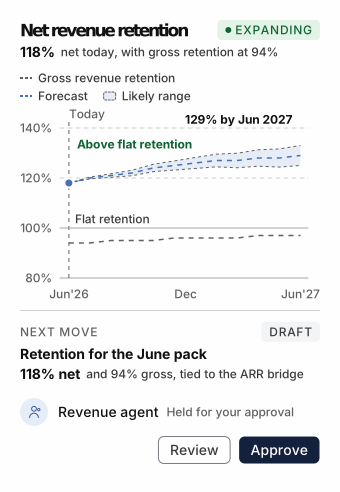
Forecast net revenue retention
Net retention forecasts expansion and contraction together, with gross retention beside it, and the Revenue agent ties both to the ARR bridge.
- Today
- 118% net, 94% gross today
- Forecast
- 129% net by Jun 2027
- Next move
- Revenue agent ties both to the ARR bridge
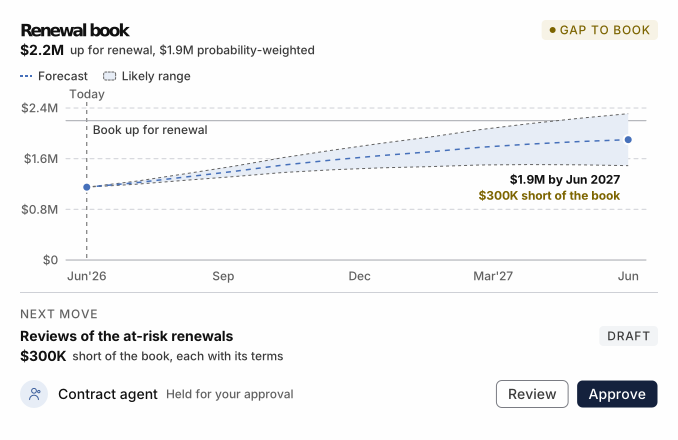
A renewal number with its probability behind it
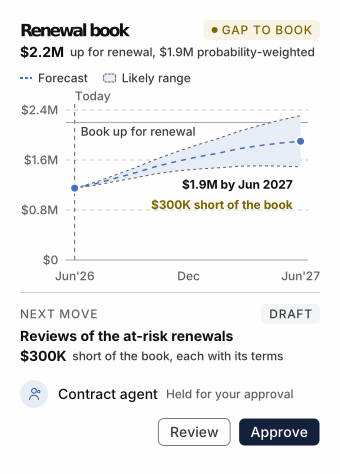
Each renewal carries a probability, so renewing revenue is valued at it and any shortfall is named in dollars before it is due.
- Today
- $300K short of the $2.2M up for renewal
- Forecast
- $1.9M weighted by Jun 2027
- Next move
- Contract agent reviews the $300K gap
Know what an account is worth
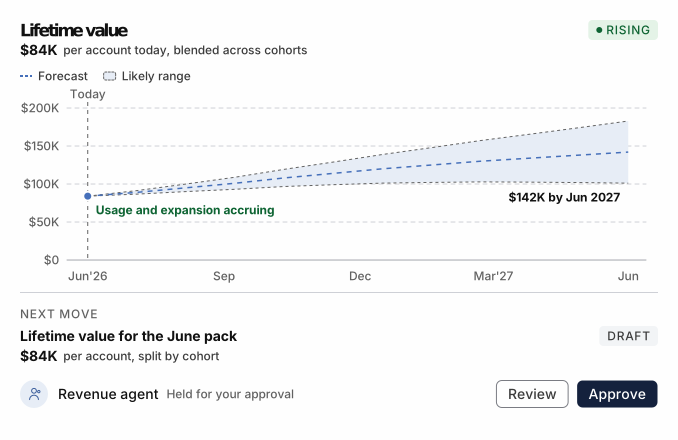
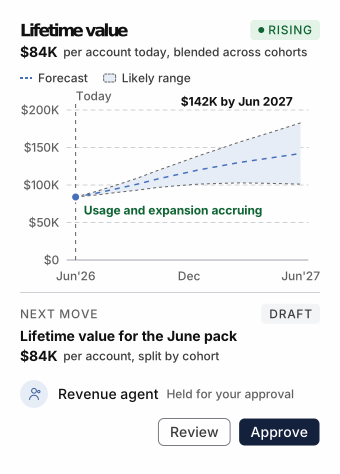
Lifetime value is projected per account from its billing history, then blended across customer groups, starting from this month's invoices.
- Today
- $84K per account today
- Forecast
- $142K by Jun 2027
- Next move
- Revenue agent reports $84K by cohort
Forecast when the money is likely to land
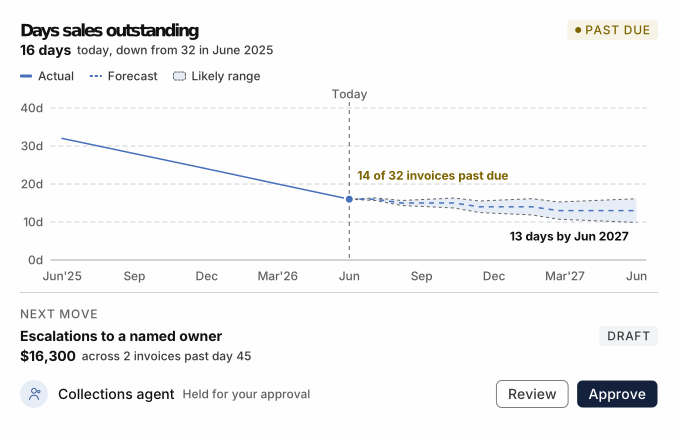
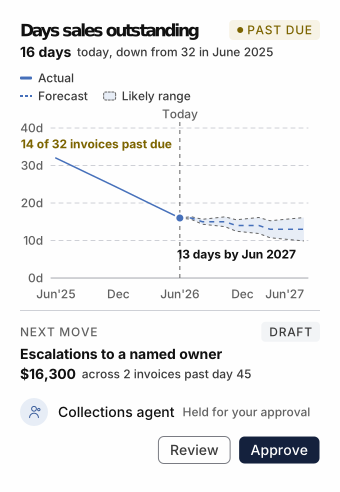
DSO is forecast from how each customer actually pays, not the terms they signed, and only the cases that need a person are escalated.
- Today
- 16 days today, 14 of 32 invoices past due
- Forecast
- 13 days by Jun 2027
- Next move
- Collections agent escalates $16,300
Revenue you already sold, by month
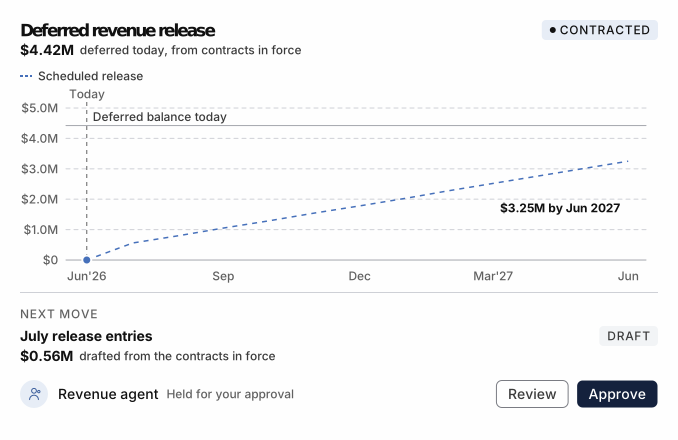
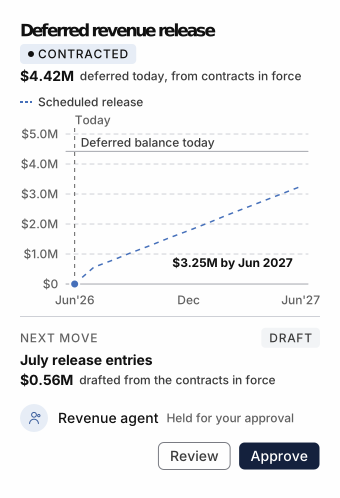
The release schedule comes from the contracts in force, not a demand forecast, and the Revenue agent drafts each month's entries from it.
- Today
- $4.42M deferred today
- Forecast
- $3.25M released by Jun 2027
- Next move
- Revenue agent drafts July's $0.56M
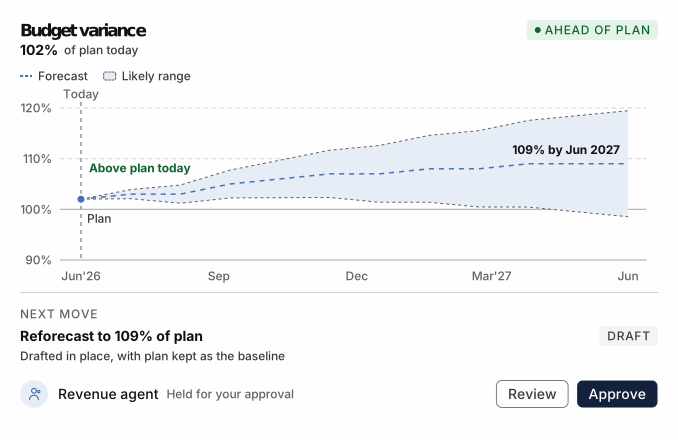
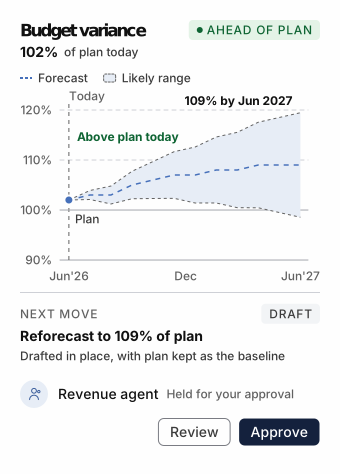
Whether you are likely ahead of plan
Forecast performance is shown against your plan, and the Revenue agent drafts a reforecast while keeping the original plan as the baseline.
- Today
- 102% of plan today
- Forecast
- 109% by Jun 2027
- Next move
- Revenue agent drafts the reforecast
Questions finance asks first
Included with Scale and above.See pricingBook demo
Keep exploring
Product
Everything between the contract and the cash
Bill, collect, recognise revenue, forecast and report from one set of numbers, so a figure on one screen matches the next.
Solutions
Cash flow forecasting
Next quarter's cash, forecast from how each customer actually pays, with its range.
Blog
The close is a pipeline problem, not a people problem
Nine-day closes are not caused by slow accountants.